Q. What do you get when you cross crochet and climate science?
A. A lot of attention on Twitter.
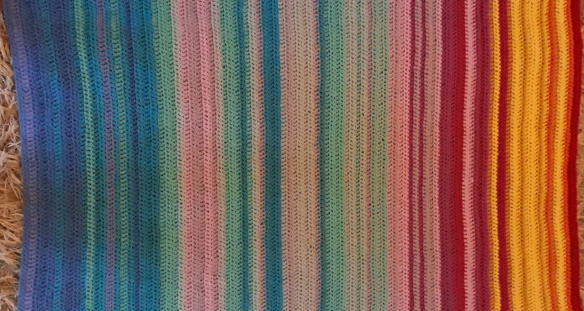
At the weekend I like to crochet. Last weekend I finished my latest project and posted the picture on Twitter. And then had to turn the notifications off because it all went a bit noisy. The picture of my “global warming blanket” rapidly became my top tweet ever, with more retweets and likes than anything else. Apparently I had found a creative way to visualise trends in global mean temperature. I particularly liked the “this is the most frightening knitwear I have seen all year” comment. Given the interest on Twitter I thought I had better answer a few of the questions in this blog. Also, it would be great if global warming blankets appeared all over the world.
How did you get the idea?
The global warming blanket was based on “temperature” blankets made by crocheters around the world. Their blankets consist of one row, or square, of crochet each day, coloured according to the temperature at their location . They look amazing and show both the annual cycle and day-to-day variability. Other people make “sky” blankets where the colours are based on the sky colour of the day – this results in a more muted grey-blue-white colour palette. UPDATE – IN 2022 I became aware that a global temperature blanket had been produced by Joan E Sheldon, an estaurine scientist and weaver in 2015 and a pattern made available on Ravelry in 2017. I had not seen this when I made my blanket, but I always thought there would likely be others out there in the textiles world. If you are here looking for the first “climate stripes” manifestation, it would be hers. )
I wondered what the global temperature series would look like as a blanket. Also, global warming is often explained as greenhouse gases acting like a blanket, trapping infrared radiation and keeping the Earth warm. So that seemed like an interesting link. I also had done several rainbow themed blankets in the past and had a lot of yarn left that needed using.
Where did the data come from?
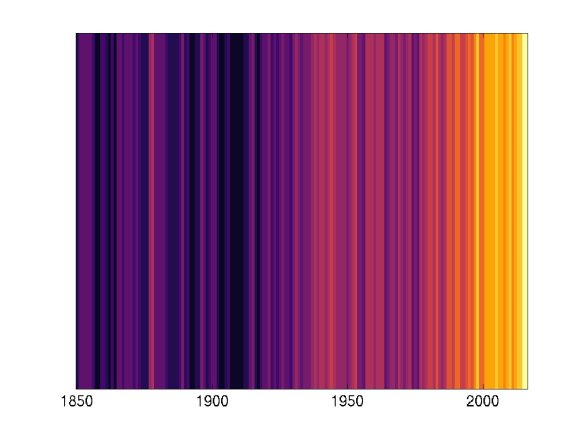
I used the annual and global mean temperature anomaly compared to 1900-2000 mean as a reference period as available from NOAA https://www.ncdc.noaa.gov/cag/time-series/global/globe/land_ocean/ytd/12/1880-2016. This is what the data looks like shown more conventionally.

I then devised a colour scale using 15 different colours each representing a 0.1 °C data bin. So everything between 0 and 0.099 was in one colour for example. Making a code for these colours, the time series can be rewritten as in the table below. It is up to the creator to then choose the colours to match this scale, and indeed which years to include. I was making a baby sized blanket so chose the last 100 years, 1916-2016.
1929 1940-46 1954-56 1991/2 1997/8
If you look closely you can see the 1997-1998 El Nino (relatively warm yellow stripe), 1991/92 Pinatubo eruption (relatively cool pink year) as well as cool periods 1929, and 1954-56 and the relatively warm 1940-46. Remember that these are global temperature anomalies and may not match your own personal experience at a given location!
Because of these choices, and the long reference period, much of the blanket has relatively muted colour differences that tend to emphasise the last 20 years or so. There are other data sets available, and other reference periods and it would be interesting to see what they looked like. Also the colours I used were determined mainly by what I had available; if I were to do another one, I might change a few around (dark pink looks too much like red in the photograph and needed a darker blue instead of purple for the coldest colour), or even use a completely different colour palette – especially as rainbow colour scales aren’t great as they can distort data and render it meaningless if you are colour blind Ed Hawkins kindly provided me with a more user friendly colour scale which I love and may well turn into a scarf for myself (much quicker than a blanket!).
How can I recreate this?
If you want to create something similar, you will need 15 different colours if you want to do the whole 1880-2016 period. You will need relatively more yarn in colours 3-7 than other colours (if, like me you are using your stash). You can use any stitch or pattern but since you want the colour changes to be the focus of the blanket, I would choose something relatively simple. I used rows of treble crochet (UK terms) and my 100 years ended up being about 90 cm by 110 cm. You can of course choose any width you like for your blanket, or make a scarf by doing a much shorter foundation row. It goes without saying that it could also be knitted. Or painted. Or woven. Or, whatever your particular craft is.

How long did it take?
I used a very simple stitch, so for a blanket this size, it was a couple of months (note I only crochet in the evenings 2 or 3 evenings a week for a couple of hours with more at some weekends). It helped that the Champions League was on during this time as other members of the household were happy to sit around watching football whilst I crocheted. Weave the ends in as you go. There are a lot of them, and I had to do them all at the end. The time flies because….
Why do I crochet?
I like crochet because you can do simple projects whilst thinking about other things, watching TV or listening to podcasts, or, you can do more complicated things which require your full attention and divert your brain from all other things. There is also something meditative about crochet, as has been discussed here (https://www.theguardian.com/lifeandstyle/2013/may/16/knitting-yoga-perfect-bedfellows) I find it a good way to destress. Additionally, a lot of what I make is for gifts or for charities and that is a really good feeling.
What’s next?
Suggestions have come in for other time series blankets e.g. greys for aerosol optical depth punctuated by red for volcanic eruptions, oranges and yellows punctuated by black for solar cycle (black being high sun spot years), a central England temperature record. Blankets take time, but scarves could be quicker so I might test a few of these ideas out over the next few months. Would love to hear and see more ideas, or perhaps we could organise a mass “global warming blanket” make-athon around the world and then donate them to communities in need.
And finally.
More seriously, whilst lots of the initial comments on Twitter were from climate scientists, there are also a lot from a far more diverse set of folks. I think this is a good example of how if we want to reach out, we need to explore different ways of doing so. There are only so many people who respond to graphs and charts. And if we can find something we are passionate about as a way of doing it, then all the better.
