Tales of the unexpected

This post was originally an article written for the online Newsletter of theWeather Club  of the Royal Meteorological Society and is reproduced here with their permission)

I spend a lot of time reading scientific papers. They are one of the main ways in which science is communicated within the academic discipline, and also one of the ways in which academics productivity is measured. Away from work therefore, I generally find it hard to summon enthusiasm for reading anything vaguely science related. However, for Christmas this year I asked for 3 of the books on the shortlist for the Royal Society’s Winton Prize for Science Books prize. I looked forward to reading these initially because of my interest in science writing, but somewhat to my surprise I quickly found myself intrigued by the science within the first one.

 Image

“Bird Sense” by Tim Birkhead discusses the evidence that birds use each of seven senses; seeing, hearing, touch, taste, smell, magnetic sense, and emotion. It is hard to say why such a topic captured my imagination but its considerable distance from my own research area certainly contributed. Imagine my surprise then to find the familiar topic of dimethyl sulphide (DMS) and even a familiar name within such a book.


DMS is a gas that is most well known as a component of the smell produced when cooking cabbage or beetroot. It is also produced at sea when phytoplankton are eaten by zooplankton (e.g. krill), the gas being first dissolved in seawater and then released to the atmosphere. Once oxidised in the marine atmosphere it is a major natural source of sulphate aerosol in the marine atmosphere and may go on to affect clouds and have a significant impact on the Earth’s climate (therein lies the link to my research area). Oceanic DMS emissions account for something like 15% of the global sulphur emissions to the atmosphere and are a significant fraction of the sulphur emissions particularly in the southern hemisphere mid-latitudes. These emissions are a major player in the supposed CLAW feedback loop between atmosphere and ocean whereby climate change leads to changes in DMS emissions which then alter climate themselves, although the magnitude and even the sign of this feedback is the subject of much debate.

Image

Thus DMS is an important component of the marine atmosphere, but what does it have to do with bird senses? Seabirds in particular travel over very long distances to search for food, but many unerringly navigate safely back to their breeding grounds. Well, it could be that DMS is in fact providing a smell map by which seabirds can find their way home. Even more fascinating is the fact that this link was made via a chance encounter of biologist Gaby Nevitt with an atmospheric scientist, Tim Bates. Following an injury on a research cruise, Nevitt stayed on the ship whilst it was being prepared for a DMS transect cruise and saw the measurements of DMS across the ocean by Tim’s group. Subsequently, Nevitt and colleagues measured elevated heartbeats in birds exposed to air containing DMS and noted that the flight patterns of albatrosses were consistent with birds attempting to locate a breeding ground by smell, i.e. zigzagging across a plume rather than flying in a straight line (which would be more consistent with navigating by sight). So, far from escaping from work, I found aerosols deep in the depths of a book about bird behaviour, and a story of two science worlds colliding to produce a step change in understanding. I wonder what I will find in the other two books?

Image
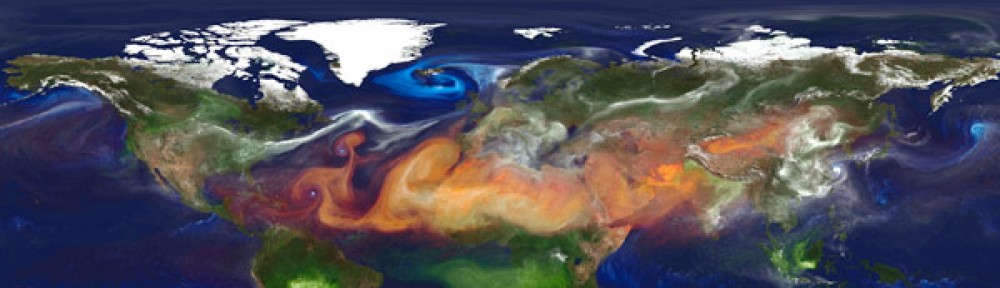
Image and more information from the Nevitt Lab

Bird Sense What it’s like to be a bird by Tim Birkhead, Bloomsbury Press 2013
Bonadonna et al (2006) Journal of Experimental Biology, 209, 2165-9

My love-hate relationship with clouds

(This blog originally appeared as an article in theWeather magazine of The Weather Club, altered with permission of RMetS)

“Window or aisle madam?” There is only one answer to this question for your average meteorologist/climate scientist. When I have to fly (and I avoid it as much as possible these days), I always opt for the window seat. On long haul to the US I may get to see sea ice, whilst on flights to Niger for a Saharan dust project it is the surprising colour variations of the world’s largest sand desert. On most flights however, it is the clouds that hold my attention. I alternate between thinking how beautiful is the multi-layered scattering of bubbly white water droplets, and despairing of ever being able to represent such an important component of our atmosphere in global climate models.

Clouds affect climate in several ways. Firstly, they are responsible for moving energy and water around our earth-atmosphere system – heat is released inside clouds when water vapour condenses to form water droplets (it’s the droplets we actually see). Secondly some (but not all) clouds lead to rainfall or other precipitation. Finally, clouds interact with both sunlight and the long-wavelength radiation emitted by the earth to space. Different types and thicknesses of clouds do this in different ways; for example high cirrus clouds mainly act like a blanket keeping the energy emitted by the earth from escaping to space. On the other hand, thick stratus clouds reflect lots of sunlight back to space preventing it from reaching the earth’s surface. Clouds change in response to surface and atmospheric temperature changes, changes in humidity and changes in atmospheric aerosol concentration (water vapour has to condense on to these tiny particles in order to form cloud droplets). Thus cloud changes are part of the atmosphere’s response to climate change, as well as being crucial for our everyday weather.

My main problem with clouds is their variability, from minute to minute and from place to place. The processes responsible for creating clouds (the condensation of water vapour onto tiny specks of “dust” (aerosol), the rising and sinking of air parcels and many others) take place on very small space and time scales. Computer models of weather and climate represent the quantities that describe our climate system (for example temperature, pressure, wind, humidity) on a stack of grids laid out across the earth. The equations that predict how these things change with time are then calculated at each of the crossing points of these grids. Any processes or events that happen between the crossing points can only be represented in some average way in these equations, and this can lead to uncertainty in our predictions. Climate models typically have grid points 10s to 100s of kilometres apart.  Even the best computer models for making weather predictions might have a resolution of 1 km (and due to computational expense this is only possible if you are considering a small area of the globe, e.g. the UK and a few days ahead at most). Most cloud processes happen on smaller scales even than this. The method of taking these into account somehow is called “parameterisation”, and considerable research effort is spent determining the best way to do this (see also the excellent PLOS blog about parameterisation and much much more by Tamsin Edwards) . We use field measurements or much more detailed models of the processes happening inside an individual cloud to develop relationships between the key quantities and those that are used in the equations of a weather or climate prediction model. Inevitably however we have to make simplifications or generalisations in some places and this can lead to diversity in how different models represent cloud and other processes and to differences in the resulting predictions.

Despite their variability and complexity, I agree with the founder of the Cloud Appreciation Society,  Gavin Pretor-Pinney, who wrote also in theWeather magazine, “life would be immeasurably poorer without them (clouds)”. My journeys by plane would however be somewhat less emotionally charged!